




.webp)
An enterprise knowledge graph organises company data — customers, products, contracts, employees, systems, and the relationships between them — as a connected network instead of isolated tables, so queries traverse meaning rather than matching columns.
It's built for mid-market and enterprise decision-makers who are watching data remain siloed across CRM, support, and billing systems, and whose generative AI pilots keep stalling on accuracy. The reason it matters now: as more of the enterprise runs on LLMs, ungrounded answers stop being a minor inconvenience and start being a trust problem, and the knowledge graph is the layer most teams are missing when that trust breaks down.
Why do you need enterprise knowledge graphs?
Most enterprise data is not broken because it is missing. It is broken because it is disconnected.
According to McKinsey, employees spend 20% of their working day searching for information they need to do their jobs. A 2024 Pyron report found that 47% of professionals spend one to five hours a day on the same search problem. Knowledge graphs do not just improve retrieval — they make retrieval a structural capability instead of an individual effort.
Three benefits show up consistently across deployments: faster knowledge discovery, cleaner AI outputs, and cross-system interoperability without migration.
At a glance: what enterprise knowledge graphs deliver
<div class="overflow-scroll" role="region" aria-label="Enterprise capabilities and owners">
<table class="rich-text-table_component">
<thead class="rich-text-table_head">
<tr class="rich-text-table_row">
<th class="rich-text-table_header" scope="col">Capability area</th>
<th class="rich-text-table_header" scope="col">What it solves</th>
<th class="rich-text-table_header" scope="col">Who owns it</th>
</tr>
</thead>
<tbody class="rich-text-table_body">
<tr class="rich-text-table_row">
<td class="rich-text-table_cell">Semantic enterprise search</td>
<td class="rich-text-table_cell">Keyword search fails across siloed systems</td>
<td class="rich-text-table_cell">IT / Knowledge management</td>
</tr>
<tr class="rich-text-table_row">
<td class="rich-text-table_cell">AI & LLM grounding (GraphRAG)</td>
<td class="rich-text-table_cell">Hallucinations undermine trust in generative AI</td>
<td class="rich-text-table_cell">AI / Data science teams</td>
</tr>
<tr class="rich-text-table_row">
<td class="rich-text-table_cell">Fraud & risk detection</td>
<td class="rich-text-table_cell">Anomalous patterns invisible in relational databases</td>
<td class="rich-text-table_cell">Finance / Compliance</td>
</tr>
<tr class="rich-text-table_row">
<td class="rich-text-table_cell">Supply chain visibility</td>
<td class="rich-text-table_cell">Fragmented supplier and inventory data</td>
<td class="rich-text-table_cell">Operations / Procurement</td>
</tr>
<tr class="rich-text-table_row">
<td class="rich-text-table_cell">Content & knowledge management</td>
<td class="rich-text-table_cell">Institutional knowledge trapped in documents</td>
<td class="rich-text-table_cell">HR / Content teams</td>
</tr>
<tr class="rich-text-table_row">
<td class="rich-text-table_cell">Regulatory compliance</td>
<td class="rich-text-table_cell">Data lineage and audit trails across systems</td>
<td class="rich-text-table_cell">Legal / Risk</td>
</tr>
<tr class="rich-text-table_row">
<td class="rich-text-table_cell">Drug discovery (life sciences)</td>
<td class="rich-text-table_cell">Disconnected experimental and publication data</td>
<td class="rich-text-table_cell">R&D / Research informatics</td>
</tr>
</tbody>
</table>
</div>
Why enterprise data stays trapped
Most enterprise data problems share a root cause: information gets captured in the system closest to where it was created, with no mechanism to connect it to anything else. CRM data does not talk to support tickets. Engineering specs do not reference customer feedback. HR systems do not know what a departing employee actually knew.
The result is not just delayed decisions. It is duplicated work, broken handoffs, and AI systems that produce answers nobody trusts. Gartner estimates poor data quality costs organizations at least $12.9 million per year, and IDC has put the revenue impact of data silos at 30% of annual revenue. Those are not abstract risks. They show up as real friction in daily work.
Mapping data challenges to graph solutions
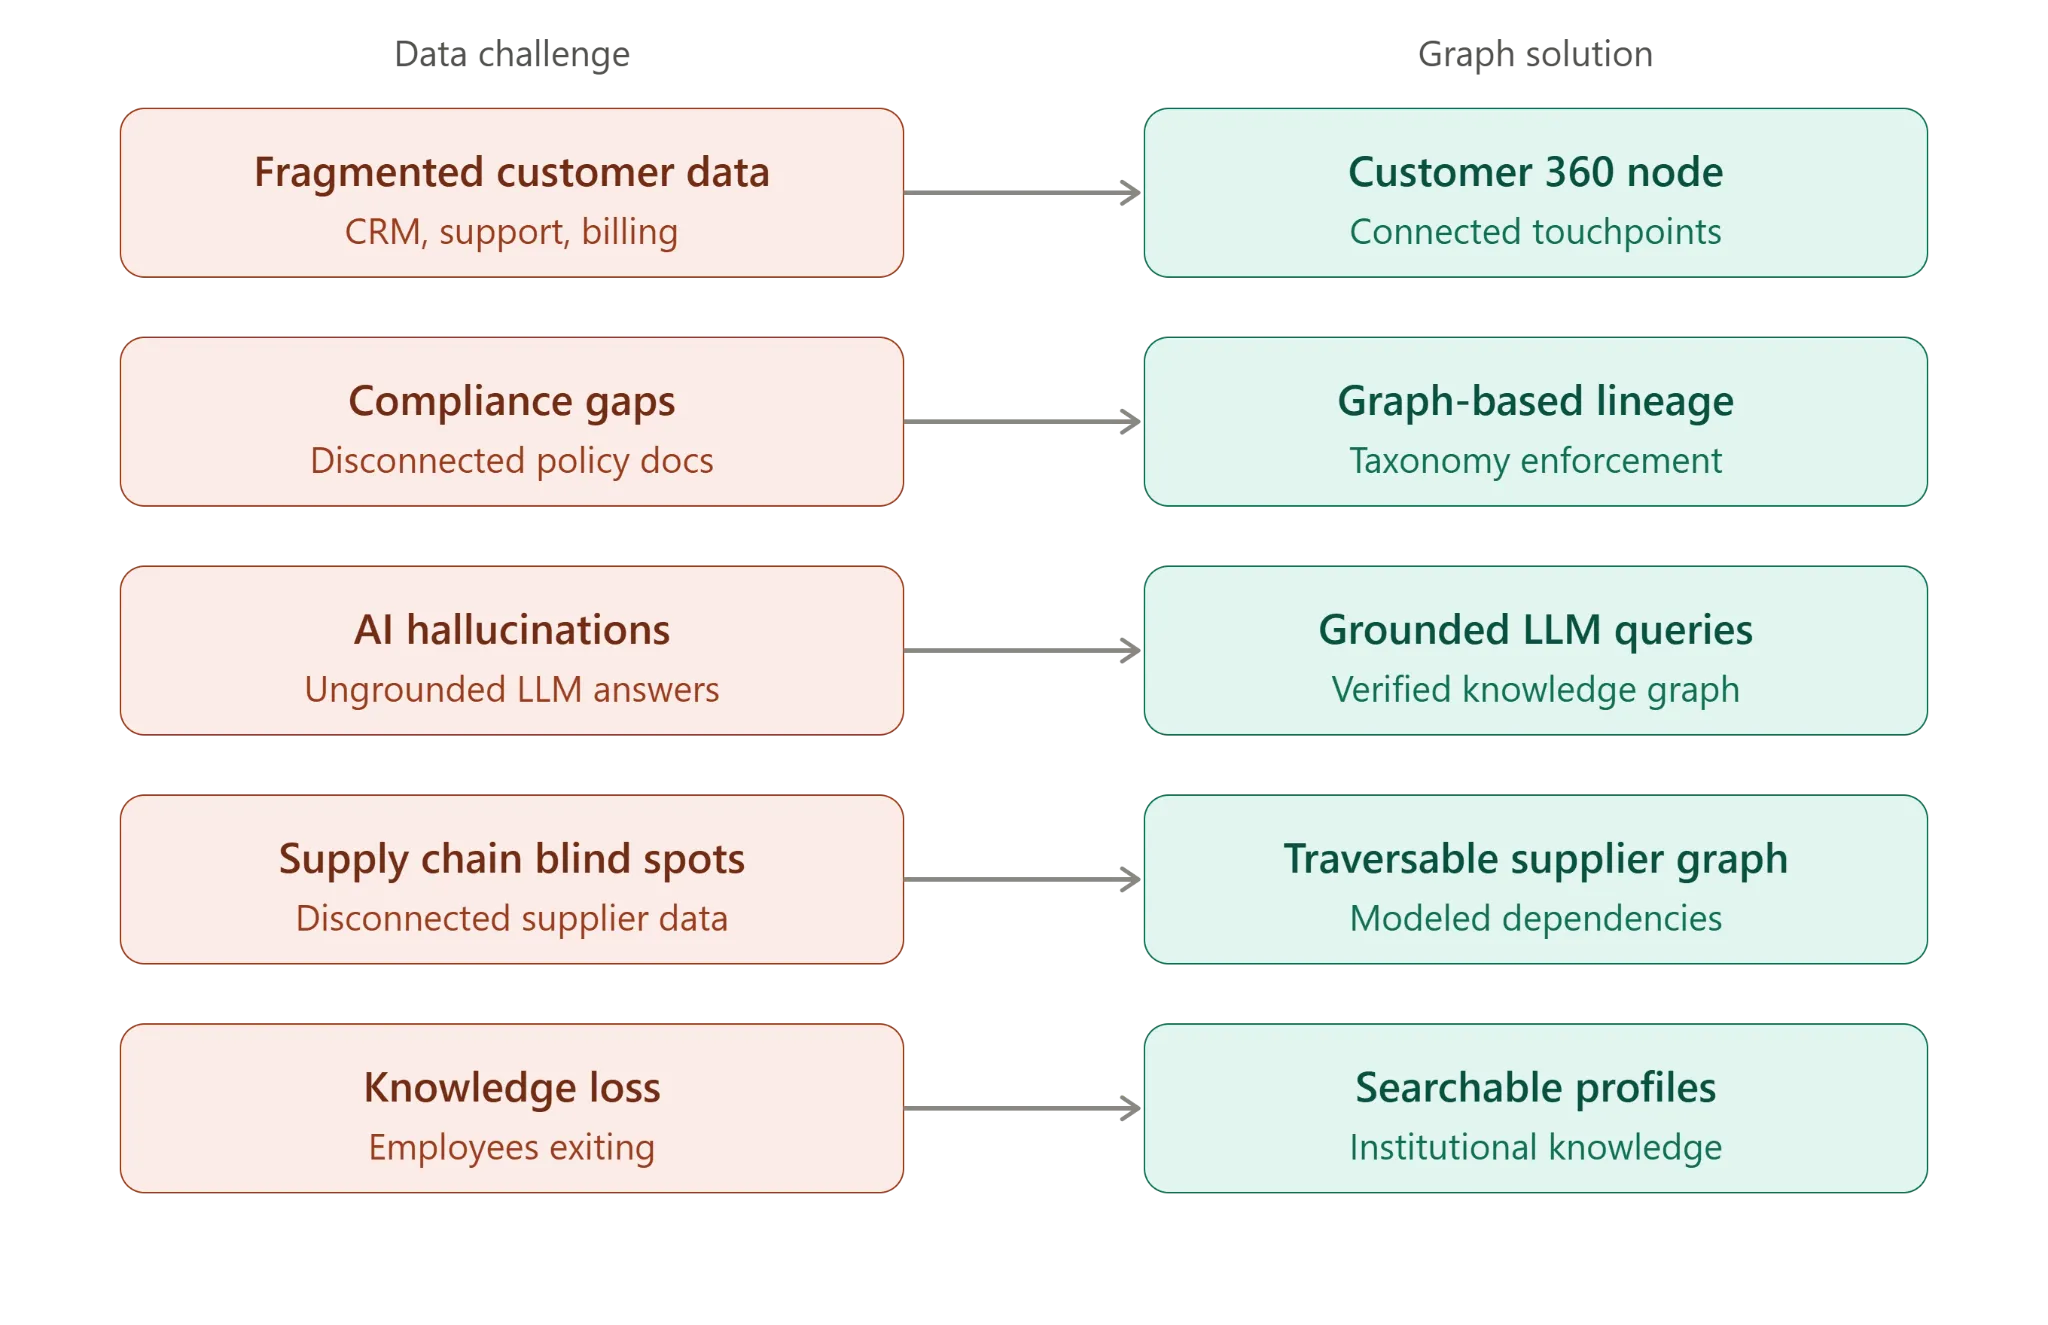
Knowledge graphs integrate with existing app ecosystems without replacing them. They sit as a semantic layer above your CRM, ERP, data warehouse, and document stores — ingesting, linking, and serving relationships back to applications through APIs and query endpoints.
Security and governance travel with the data. Provenance, lineage, and role-based access controls can be enforced at the graph level instead of bolted on afterward. In practice, that gives enterprise data a common language without requiring a migration project.
The platform landscape
Enterprise teams rarely choose a graph platform in a vacuum. More often, they compare options such as Neo4j, Amazon Neptune, Stardog, AllegroGraph, and Google Cloud Knowledge Graph, then narrow the shortlist based on cloud fit, semantic reasoning needs, developer experience, and governance requirements.
The right choice is usually less about picking the “best” graph database and more about choosing the platform that fits the systems, workflows, and AI stack you already have. For some teams, that means a graph-native developer experience. For others, it means tighter cloud integration or stronger ontology and reasoning support.
What business value do you get from knowledge graphs in 2026?
The organizations getting real value from knowledge graphs in 2026 share one thing: they treated the graph as a business initiative with a technical implementation, not the reverse.
They started with a specific business objective — reduce M&A due diligence time, surface fraud rings faster, stop losing institutional knowledge when senior employees retire and worked backward to the ontology.
Stakeholder roles that actually matter
- Chief data officer / VP of data: owns the graph governance model and ontology standards
- Domain leads (finance, HR, operations): define the entities and relationships that matter in their domain
- Data engineering: builds and maintains ingestion pipelines, connectors, and monitoring
- AI / ML teams: integrate the graph into retrieval pipelines and validate LLM grounding
- Legal / compliance: validate access controls, audit trail requirements, and regulatory taxonomies
A pragmatic adoption roadmap
Phase 1 — Prove value in one domain. Pick the use case with the clearest pain (usually search or fraud). Build a lean ontology. Measure before and after.
Phase 2 — Expand to adjacent systems. Connect two or three more data sources. Add governance tooling. Begin tracking data quality metrics.
Phase 3 — Scale to AI workflows. Integrate the graph with your LLM stack via GraphRAG. Log interactions to continuously enrich the graph.
How knowledge graphs bring value to enterprise data
Context: data that knows what it means
A traditional database stores facts. A knowledge graph stores facts plus their meaning. When your system knows that a customer who filed three support tickets, clicked a renewal campaign, and has a contract expiring in 60 days is at risk — not because a query joined those tables, but because the graph modeled that relationship explicitly — you have context. That context is what makes downstream AI and search actually useful.
Interoperability: crossing the silo without migration
One of the most practical value propositions is what knowledge graphs don't require. You don't need to migrate systems. You don't need a single data warehouse. The graph ingests from your existing sources — SQL databases, data lakes, CRM platforms, wikis, log files — and creates a unified semantic layer above them. Each new connector activates additional query paths without disrupting the source system.
Speed: faster answers from connected data
Enterprise Knowledge's case study of a global investment firm managing over $250 billion in assets shows what this looks like in practice. Analysts spent hours manually assembling M&A due diligence packages across 12 disconnected systems. After deploying a knowledge graph portal with semantic search and graph visualization of ownership structures, that work collapsed to minutes. The graph didn't just speed up retrieval — it surfaced connections analysts hadn't known to look for.
7 core enterprise knowledge graph use cases
Managing content as structure, not storage
Most enterprise content problems aren't volume problems. There's plenty of content — it just can't be found, connected, or trusted to be current. A knowledge graph reframes content management from storage to structure.
Semantic tagging and discoverability.
Rather than relying on manual tagging (inconsistent) or keyword search (brittle), knowledge graphs apply NLP pipelines to automatically extract entities from content and link them to the graph's ontology. A document about a product recall links to the product node, the affected customer segment, the regulatory requirement, and the team responsible — automatically. Search queries traverse those links instead of matching strings.
Automated metadata enrichment.
NLP-based entity extraction assigns structured metadata to unstructured content at ingestion. Every new document, report, or email that enters the system gets tagged with relevant entities and linked to existing nodes without manual effort. Over time, the graph becomes a self-enriching index of the organization's content.
Personalized internal content delivery.
Once the graph knows who you are — your role, your projects, your team, your past queries — it can surface relevant content proactively. An engineer working on a product launch sees related compliance documents, prior QA results, and similar past projects, not because they searched for them, but because the graph connected the dots.
Preserving institutional knowledge
The cost of institutional knowledge loss is one of the most undercounted risks in large organizations. A survey cited by metaphacts found that 60% of respondents said it was difficult or almost impossible to get crucial information from colleagues, and 90% said retiring employees caused serious knowledge loss. The knowledge graph isn't a cure for that — but it's the closest thing to a structural defense against it.
Unified expertise profiles.
Graph nodes for employees connect to the projects they've worked on, the documents they authored, the systems they built, and the decisions they influenced. When someone leaves, their knowledge doesn't leave with them — it exists as a traversable part of the graph, accessible to whoever fills their role.
Surfacing legacy system knowledge.
Critical institutional knowledge often lives in systems nobody can read anymore — old wikis, retired databases, email threads from five years ago. Knowledge graph ingestion pipelines, combined with NLP extraction, can surface entities and relationships from these sources and connect them to current data, without requiring anyone to manually port the content.
Offboarding and knowledge transfer.
A well-maintained graph makes offboarding tractable. When an employee's node is queried, the graph returns their domain expertise, their active relationships, and the systems they touched. Their manager gets a structured transfer brief, not a blank page.
AI grounding — the fix for hallucinations
77% of businesses express concern about AI hallucinations, and 47% of enterprise AI users made at least one major decision based on hallucinated content in 2024 (source: Fullview AI statistics, 2025). The most urgent knowledge graph use case in 2025 isn't search — it's making generative AI safe enough to deploy. And those two things turn out to be the same problem.
Powering AI assistants with a semantically grounded graph.
When an internal AI assistant is asked about escalation policy for a Tier 1 customer, it needs to retrieve a verified, current answer — not generate a plausible-sounding one. The knowledge graph provides the query endpoint: the assistant asks the graph, receives a structured subgraph of relevant entities and relationships, and uses that as the factual foundation for its response. SAP's implementation of GraphRAG uses exactly this pattern to ground LLM queries against their business process metadata, data models, and documentation assets.
Constraining generative outputs with graph-backed context.
GraphRAG — retrieval-augmented generation using a knowledge graph — outperforms traditional vector-based RAG in a specific and important way: it handles multi-hop reasoning. When the answer to a question exists across connected documents rather than in a single chunk, vector search struggles. Graph traversal doesn't. Microsoft's GraphRAG implementation uses community detection on large document collections to build hierarchical summaries, enabling global reasoning that flat vector search can't achieve.
LinkedIn's deployment reduced ticket resolution time from 40 hours to 15 hours — a 63% operational improvement — by routing support queries through a GraphRAG system rather than manual knowledge base searches. FalkorDB's GraphRAG SDK has documented a 90% hallucination reduction compared to traditional RAG, with sub-50ms query latency in production.
Hybrid vector and graph retrieval.
The production architecture most teams land on in 2025 is a hybrid: vector search handles broad semantic similarity, graph traversal handles relationship-dependent queries that require multi-hop reasoning. Both feed into the LLM as context. The graph acts as a verification layer — claims that contradict the graph get flagged before they reach the user.
Accelerating drug discovery and life sciences
Biomedical data is, structurally, a graph problem. Compounds relate to targets, targets relate to pathways, pathways relate to diseases, diseases relate to patient cohorts, cohorts relate to clinical outcomes. Every piece of this knowledge lives in a different system — electronic lab notebooks, assay platforms, publication databases, regulatory submissions. A biomedical knowledge graph consolidates it.
Consolidating experimental data. Rather than analysts manually cross-referencing assay results with publication databases and trial data, the graph ingests all three, links compounds to their experimental evidence, and surfaces relationships that would otherwise require weeks of manual literature review to discover.
Hypothesis generation from connected evidence. The most valuable output of a biomedical knowledge graph isn't retrieval — it's inference. When a compound shows activity against a target also known to be implicated in a second disease, the graph surfaces that connection. Researchers use this for drug repurposing: finding new clinical applications for approved compounds by traversing the evidence graph rather than starting from scratch.
Regulatory submission tracing. For regulatory submissions, every claim must be traceable to its evidence. A knowledge graph provides that lineage automatically: each node carries the source data, the extraction confidence, and the timestamp. Auditors query the graph rather than manually reconstructing evidence chains from hundreds of documents.
Detecting fraud relational databases miss
Fraud doesn't live in a single record. It lives in the pattern of relationships across records — shared addresses, linked accounts, suspiciously similar claim sequences across different names. Relational databases aren't built to surface those patterns efficiently. Enterprise Knowledge's fraud detection deployment for a national insurance regulator used property graph databases to model claimants, policies, and claims as interconnected nodes, with Jaccard similarity and community detection algorithms surfacing fraud rings that traditional systems had missed entirely.
Detecting anomalous entity relationships. Graph analytics flags entities with unusual relationship profiles — a claimant appearing under slightly different names across multiple policies, a device ID associated with suspiciously high transaction volumes across disconnected accounts. These patterns emerge from traversal, not from column-level queries.
Transaction flow tracing. AML investigations require following money through chains of transactions and entities. A knowledge graph models each transaction as an edge, each account as a node, and each beneficial owner as a connected entity. Pathfinding algorithms trace flows across dozens of hops in seconds — work that previously required investigative analysts days to reconstruct manually.
Compliance audit trails. DataWalk, used as part of the U.S. Department of Justice's investigative toolkit, demonstrates what production-grade compliance graph analytics looks like: link analysis across disparate sources, visual case management, and traceable audit records that hold up in regulated proceedings.
Automating workflows and business processes
Graph relationships don't just describe data — they can trigger actions. When the graph infers that a contract is expiring, a supplier has crossed a risk threshold, or an inventory node has dropped below its linked reorder point, it can fire workflow events into downstream systems without human intervention.
Graph-driven workflow triggers. Inferred relationships become automation signals. A customer node that crosses a churn risk threshold — based on connected support escalations, product gaps, and usage data — automatically triggers a sales alert. An employee node connected to a project deadline and an open compliance certification gap triggers an HR intervention. The graph makes these inferences explicit and actionable.
Cross-team approval orchestration. Complex approvals — procurement, legal review, executive sign-off — involve relationships between entities across teams and systems. A graph-driven rules engine models who needs to approve what, under what conditions, and in what order, pulling real-time data from connected systems rather than relying on static workflow configurations.
Resource allocation from connected inventory views. Supply chain and inventory management was the largest revenue segment in the enterprise knowledge graph market in 2024. When inventory, supplier capacity, logistics partners, and demand forecasts all exist as connected nodes, resource allocation becomes a traversal problem — the graph finds the optimal path, not a human analyst.
Enforcing security, compliance, and governance
Data governance is where knowledge graphs move from useful to essential. As enterprises face GDPR, HIPAA, SOC 2, and sector-specific compliance requirements, the ability to prove what data exists, where it came from, who can access it, and how it's been used becomes a hard business requirement.
Graph-based access controls. Permissions are modeled as graph relationships: a user node connects to the data nodes they're authorized to access, filtered by their role node, their department node, and active policy nodes. When a policy changes, the graph updates access paths automatically — no manual permission updates across disconnected systems.
Data provenance and audit trails. Every node in a well-designed enterprise knowledge graph carries provenance metadata: source system, extraction timestamp, confidence score, last-modified timestamp. Compliance auditors query the graph to reconstruct data lineage for any entity — not by searching through logs, but by traversing the graph's built-in audit trail.
Regulatory taxonomies inside the graph. Regulatory concepts — data categories, retention policies, cross-border transfer rules — are modeled as graph nodes and linked to the data entities they govern. When a new regulation introduces a new data category, the taxonomy update propagates through the graph automatically, flagging affected data entities for review.
How to implement enterprise knowledge graphs
The most common implementation failure is overbuilding the ontology before proving any value. Teams spend six months designing a comprehensive schema, then lose stakeholder support before a single query runs in production. The approach that works is narrower: start with a specific pain, build the minimum ontology to address it, and measure.
Step 1: Inventory source systems.
Map every system that holds data relevant to your target use case. For each source, document the entities it contains, how they're identified, how frequently the data changes, and what APIs or connectors are available. This isn't a full data audit — it's a pragmatic inventory scoped to the pilot use case.
Step 2: Design a pragmatic ontology.
Only model what you'll actually query. A lean graph performs better and is easier to maintain than a comprehensive one that nobody queries. Use human-readable identifiers and labels. Add metadata like timestamps, sources, and confidence levels so AI agents can reason about trust. Plan access controls into the schema from day one.
Step 3: Set up connectors.
ETL processes or streaming connectors map source data into the graph's schema. NLP pipelines extract entities and relationships from unstructured sources — documents, emails, support tickets. Start with the two or three highest-value source systems. Add connectors iteratively as the pilot proves value.
Step 4: Instrument monitoring.
Track graph quality metrics from the start: entity resolution accuracy, relationship coverage, data freshness, query latency. Without monitoring, graph quality degrades silently as source data changes. With it, quality issues surface before they affect downstream applications.
Integration patterns with language models and AI
GraphRAG: the production pattern
The GraphRAG pattern routes user queries through three steps: entity recognition (the LLM identifies the entities in the query), graph traversal (the system retrieves the relevant subgraph), and grounded generation (the LLM generates a response using the retrieved graph context). The result is an AI system that can explain its reasoning — each response traces back to specific graph nodes and edges.
Research published in the ACL Anthology confirms that knowledge graph-augmented LLMs consistently outperform ungrounded models on factual accuracy, particularly in domains where precision matters — healthcare, finance, and legal applications.
Verification steps for model-generated claims
In production deployments, graph-backed verification runs as a check on LLM outputs before they reach users. Claims that contradict verified graph relationships are flagged or filtered. This isn't a blocker for AI adoption — it's what makes AI adoption sustainable in regulated or high-stakes environments.
Logging interactions for continuous graph enrichment
Every user query that the graph can't fully answer is a signal that the graph has a gap. Logging query patterns and resolution failures creates a continuous improvement queue for graph enrichment. The system gets smarter over time, not by retraining a model, but by expanding the graph's coverage.
Measuring impact and ROI
Quantifying knowledge graph ROI is genuinely difficult — the benefits are often structural rather than transactional. But that doesn't mean unmeasurable. A global IT services firm that deployed a graph-backed knowledge assistant across 300 support agents saved over 15,000 agent hours, shortened project implementation timelines by 11%, and saw a 3.8% boost in customer retention tied directly to faster, more accurate support responses.
KPIs tied to productivity and search relevance
<div class="overflow-scroll" role="region" aria-label="Knowledge graph initiative metrics">
<table class="rich-text-table_component">
<thead class="rich-text-table_head">
<tr class="rich-text-table_row">
<th class="rich-text-table_header" scope="col">Metric</th>
<th class="rich-text-table_header" scope="col">What it measures</th>
<th class="rich-text-table_header" scope="col">Target range</th>
</tr>
</thead>
<tbody class="rich-text-table_body">
<tr class="rich-text-table_row">
<td class="rich-text-table_cell">Average information retrieval time</td>
<td class="rich-text-table_cell">Minutes saved per knowledge search</td>
<td class="rich-text-table_cell">50–70% reduction</td>
</tr>
<tr class="rich-text-table_row">
<td class="rich-text-table_cell">AI assistant accuracy rate</td>
<td class="rich-text-table_cell">% of responses grounded in verified graph facts</td>
<td class="rich-text-table_cell">> 90% verified responses</td>
</tr>
<tr class="rich-text-table_row">
<td class="rich-text-table_cell">Fraud ring detection rate</td>
<td class="rich-text-table_cell">New fraud patterns surfaced vs. prior period</td>
<td class="rich-text-table_cell">Baseline + 30–40%</td>
</tr>
<tr class="rich-text-table_row">
<td class="rich-text-table_cell">Ontology coverage</td>
<td class="rich-text-table_cell">% of key business entities modeled in the graph</td>
<td class="rich-text-table_cell">> 80% of pilot domain</td>
</tr>
<tr class="rich-text-table_row">
<td class="rich-text-table_cell">Query resolution rate</td>
<td class="rich-text-table_cell">% of queries answered without escalation</td>
<td class="rich-text-table_cell">Track monthly improvement</td>
</tr>
<tr class="rich-text-table_row">
<td class="rich-text-table_cell">Data freshness</td>
<td class="rich-text-table_cell">Age of graph data vs. source systems</td>
<td class="rich-text-table_cell">< 24 hours for live systems</td>
</tr>
</tbody>
</table>
</div>
Running measurable pilots
Pick a use case with a clear before-and-after: the time an analyst spends assembling an M&A brief, the number of fraud alerts that require manual investigation, the time a new employee spends finding onboarding resources. Measure the baseline before deploying the graph. Measure again at 30, 60, and 90 days. Present the delta.
Adoption playbook for enterprise teams
Stakeholder workshops: align before you build
The fastest way to kill a knowledge graph initiative is to let engineering pick the first use case. Run structured workshops with domain leads — finance, HR, operations, legal — to surface where data fragmentation costs them real time and decisions. The use case that emerges from those conversations will have stakeholder commitment built in, which matters when you need access to source systems and budget for Phase 2.
Focused pilots in high-value departments
Start in the department where the pain is sharpest and the stakeholder is most willing. Enterprise Knowledge's documented implementations consistently follow this pattern: one department, one well-defined problem, a pragmatic ontology scoped to that problem, and a measurement plan established before deployment. Expanding to a second department with a working pilot is straightforward. Expanding without one is a governance fight.
Scale iteratively based on measured outcomes
The graph scales by adding connectors and ontology nodes, not by rebuilding. Each new data source that joins the graph increases the value of every existing node, because now more relationships can be traversed. This compounding effect is the structural argument for starting early: the sooner you build the graph, the more valuable it becomes as you add to it.
The organizations seeing the most value from enterprise knowledge graphs in 2025 aren't the ones who built the most comprehensive ontology. They're the ones who proved value fastest in one domain, then expanded with organizational momentum behind them.
The bottom line
The enterprise knowledge graph market reached $2.89 billion in 2025, growing at 21–33% CAGR depending on the analyst. Gartner expects major cloud platforms to integrate knowledge graph services as standard infrastructure. The adoption wave isn't coming — it's here, and the organizations that move early are building a structural advantage that compounds.
The decision isn't whether to build a knowledge graph. It's which problem to solve first, which department to start in, and how to measure the outcome clearly enough to fund the next phase. Start there.
Frequently asked questions
What is the difference between a knowledge graph and a relational database?
A relational database stores facts in rows and columns and retrieves them by joining tables on matching keys. A knowledge graph stores facts plus the explicit relationships between them, so queries traverse meaning directly. The practical difference shows up in multi-hop questions, which a graph answers through traversal but a relational database answers only through joins.
Do I need to migrate my existing systems to build a knowledge graph?
No. A knowledge graph sits as a semantic layer above your existing systems rather than replacing them. It ingests from SQL databases, data lakes, CRM platforms, wikis, and log files through connectors and serves relationships back to applications via APIs and query endpoints.
How is GraphRAG different from vector-based RAG?
Vector-based RAG retrieves text chunks by semantic similarity, which works well when the answer lives in a single passage. GraphRAG retrieves a connected subgraph, which is better at multi-hop reasoning — questions whose answers are spread across connected documents. In production, most teams run a hybrid: vector search for broad similarity, graph traversal for relationship-dependent queries, with the graph acting as a verification layer.
How long does it take a knowledge graph pilot to show ROI?
A well-scoped pilot typically shows measurable results within a 30-to-90-day window. The key is picking a use case with a clear before-and-after metric, measuring the baseline before deployment, then measuring again at 30, 60, and 90 days.
Is a knowledge graph the same as building one giant ontology up front?
No, and treating it that way is one of the most common reasons initiatives stall. The approach that works is to model only what you will actually query, scoped to a single high-value use case, then expand the ontology iteratively as each phase proves value.
What is the difference between a knowledge graph and a context graph?
A knowledge graph usually models stable domain facts and relationships across the business. A context graph adds user intent, role, workflow state, and recent activity, which makes it especially useful for personalization and agentic AI.
Which knowledge graph platform should I choose?
Choose based on the problem you need to solve, not the feature list. Neo4j often enters the conversation for graph-native developer tooling, Amazon Neptune for managed cloud graph workloads, Stardog and AllegroGraph for ontology-heavy and reasoning-focused use cases, and Google Cloud Knowledge Graph for teams that want tighter alignment with the broader cloud stack.
