


Modern infrastructure teams don’t usually lack data. They lack a clear, shared judgment.
At Glean, we ran into a recurring problem: we support hundreds of isolated customer deployments, and as we scaled, it became increasingly difficult to manually monitor system health across critical infrastructure components and deployments. At the same time, signals for internal service health were spread across many disparate sources — dashboards, logs, tickets, alerts, and chat threads — making it impossible to quickly get an accurate top-level view of deployment health for a given customer. This gap was especially painful for customer-facing GTM teams, who needed a reliable summary of customer health but did not have deep expertise in each underlying engineering system.
So, we built the Health Agents platform on top of Glean Agents: a system of proactive, dedicated agents that continuously monitor key infrastructure domains across all deployments, turning messy signals into clear health judgments and explanations.
Building an agentic health monitoring platform
Health Agents is an extensible platform that monitors the critical infrastructure components of each customer deployment. Instead of forcing everyone at Glean to interpret raw dashboards, logs, alerts, and tickets themselves, the platform produces a top-level deployment health report backed by specialized component health agents.
Each component health agent is responsible for interpreting signals in its own domain, such as query serving latency and reliability, search indexing freshness, ML pipeline stability, database instance health, document ingestion reliability, and more. The agents evaluate disparate inputs and produce a structured output:
- A clear green / yellow / red health judgment
- A short explanation of the main issue(s) and downstream impact
- Supporting links, drill-down views, and recommended next actions
The component-level reports roll up into a customer deployment-level report, providing both a quick top-level health summary and entry points into deeper investigation for GTM and Engineering teams.

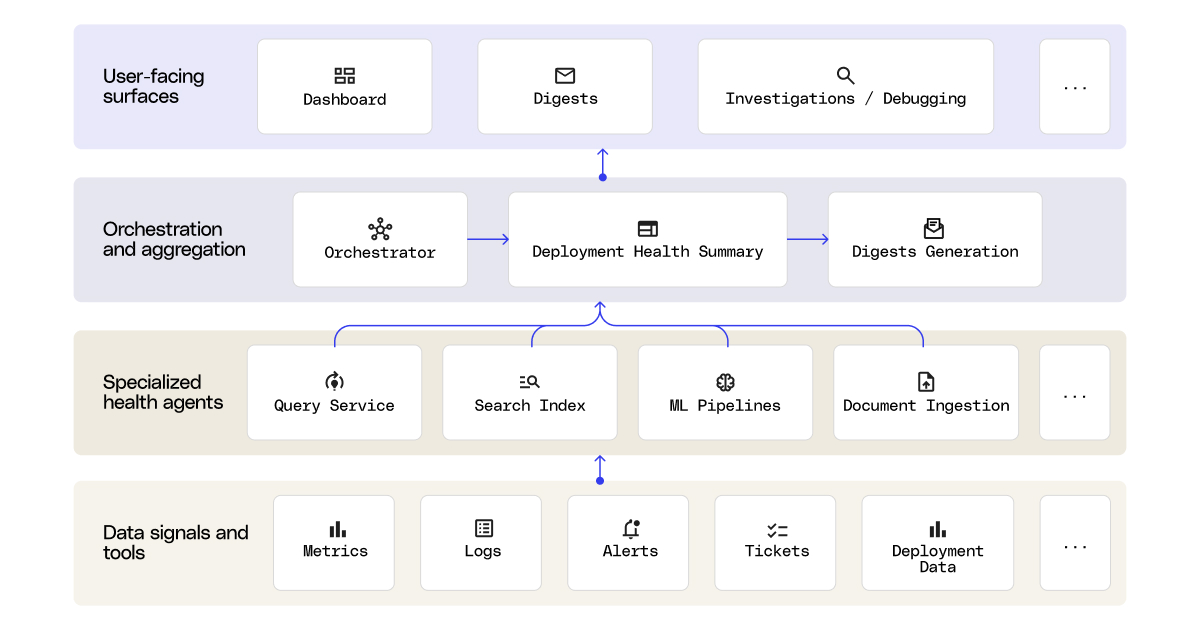
System architecture
Under the hood, Health Agents is a layered system that combines Glean Agents with a custom orchestration and aggregation layer:
- Raw signals: metrics, logs, alerts, tickets, deployment metadata, cost reports, and other operational context.
- Specialized component health agents: domain-specific agents built and owned by the experts closest to each part of the stack.
- Orchestration and aggregation: a custom-built service that handles health report aggregation, configurable health agent scheduling at scale, health report storage, and APIs for internal tooling integrations.
- User-facing surfaces: internal monitoring dashboard, issue source links, and proactive outputs that help teams assess deployment health and take next actions.
We made Health Agents scalable by building on Glean Agents as the runtime foundation, with Glean Agent Builder’s auto-mode enabling the quick creation of new specialized agents from natural language instructions. Rather than creating agents from scratch for each infrastructure component, we encoded shared health judgment into reusable agent skills for gathering signals from disparate sources, interpreting them, and producing a consistent, explainable health report. This structure made it easy for different engineering teams to extend the monitoring platform with new health agents for their domains.
Alongside the specialized health agents, we also built a weekly digest agent that runs across all customer deployments to analyze health trends and surface recurring or emerging issues.
Health Agent design tradeoffs
Specialization was our core design principle: scoped agents produce more accurate and reliable results than generalist ones. We applied that principle in two ways.
First, we separated component health expertise from deployment-level health aggregation. This was useful because comprehensive system health is not one problem; it’s a collection of domain-specific problems. For example, the signals that indicate an ML training pipeline is unhealthy are different from the signals that indicate a query service is down, and they also have different levels of downstream impact. By having domain experts maintain each component health agent, we preserved the nuance needed for good judgment. Meanwhile, the deployment-level agent synthesizes component health into a single grounded report that users can quickly interpret.
That separation gave us three benefits:
- Better explainability. Each health judgment is grounded in a clearly defined, traceable set of signals and scoring logic.
- Better maintainability. Teams can improve one component health agent without rewriting the whole system.
- Better portability. The same pattern can scale across deployments, components, and new monitoring domains over time.
Second, we separated lightweight health monitoring agents from deeper internal debugging agents. Health agents are optimized for breadth: frequent runs, broad coverage, structured outputs, and lower cost. Debugging agents are optimized for depth: richer investigation once an issue has surfaced. That handoff adds complexity, but in practice it lets us optimize for output quality and consistency while evolving detection and debugging capabilities independently, instead of forcing one catch-all agent to do everything.
Trust and calibration
We shipped early versions of Health Agents to a small group of pilot users within Glean before expanding usage to the entire company. In the process, we learned that user trust is essential to making an agentic system useful. We built that trust through a few concrete mechanisms:
- High-quality data: each specialized agent starts with a small set of high-signal indicators that can produce a useful health judgment for that domain.
- Explainability: each health report explains exactly what looks wrong across each infrastructure component, what the downstream impact is, and where to go next.
- Feedback and iteration loops: continuous user feedback became a core part of the system, informing agent skills updates, monitoring coverage expansion, UX improvements, and follow-on actions.
User input shaped both agent behavior and the surrounding product experience. In early pilots, some specialized agents were too aggressive in labeling components as critical or degraded, so users started discounting those judgments. To reduce the noise, we worked with the relevant engineering domain experts to clarify which conditions should trigger immediate action vs. just be flagged for closer inspection. We also found that users needed better visibility into which agent-detected issues were recent vs. long-running, which led us to add historical health trend charts and top-level uptick / downtick indicators in the agent-powered dashboard. Lastly, to help users understand the broader context around infrastructure health issues, we used Glean Artifacts to create interactive visual reports and dependency diagrams to complement the monitoring dashboard.
Health Agents showed us that agent quality is a product problem, not just a prompt problem. The quality of an agentic system depends on the whole user experience: ease of use, reliability, consistency across surfaces, explainability, and clear value.
Impact of Health Agents
Today, Health Agents are used in daily workflows at Glean across both the GTM and Engineering orgs, covering critical infrastructure components across all customer deployments. Within GTM, account teams are able to spot and understand customer deployment health issues proactively without needing to involve engineers. Within Engineering, we use Health Agents to monitor our own infrastructure areas across deployments, check whether a recent regression is isolated or widespread, and quickly find correlated issues across dependent components.
A few examples:
- Customer expansion readiness: before a 10,000+ user expansion, the account team used Health Agents to get a top-level health snapshot, flag components nearing resource limits, and route follow-ups to the right engineering owners before go-live.
- Faster customer meeting prep: instead of checking multiple dashboards, logs, and Slack threads before a customer call, the SAs and SEs assigned to an account can quickly get a top-level customer health view and drill deeper if something looks off.
- Cross-deployment health visibility: engineering oncalls can see whether an issue is isolated or part of a broader pattern across deployments, and easily find issue trends and correlations.
In addition to usage, we also benchmark agent quality by comparing agent-detected issues with customer escalations and other issue channels. We track proactive escalation detection rate and issue detection lead time to continuously improve Health Agents over time.

Where this goes next
Today, Health Agents at Glean proactively catch and explain issues across deployments by turning fragmented signals into clear health judgments. As the system becomes increasingly integral in daily workflows, the next areas of investment are expanding signal coverage, automating agent tuning based on quality metrics, tightening the loop between surfaced issues and next actions, and deepening integrations with other internal tools. Together, these provide the necessary steps toward closed-loop remediation: an agentic system that moves from detection to diagnosis to resolution, with humans in the loop only for higher-risk actions and final verification.