



Key Metrics for Evaluating Token Efficiency in AI Systems
Token efficiency metrics measure how effectively an AI system converts token consumption into completed work. They are the fastest way to surface hidden costs in agent, copilot, and assistant deployments.
Most organizations monitor tokens the way early cloud adopters monitored compute hours: in aggregate, without tying consumption to outcomes. Token usage analysis changes that by connecting every input and output token to the task it served, the model that processed it, and the result it produced.
This article breaks down the metrics that matter most, starting with cost per resolved task, then moving through normalized token accounting, per-workflow tracking, and output-weighted analysis. The goal is to help you evaluate AI agent performance against actual business value rather than raw consumption.
Cost per resolved task: tying tokens to outcomes
Cost per resolved task is the total token spend (input plus output, weighted by model pricing) required to complete a single unit of work. That unit might be a support ticket deflected, a question answered accurately, or a document drafted and approved.
The metric matters because a single agent task rarely involves one LLM call. It may chain multiple model invocations, tool calls, and retrieval steps before the work is done. Tracking cost per request hides the true expense of that full trajectory.
To compare token spend across model tiers fairly, GitHub's engineering team introduced the Effective Tokens (ET) formula: ET = model multiplier x (1.0 x new input tokens + 0.1 x cache-read tokens + 4.0 x output tokens). The model multiplier normalizes for price differences between a lightweight model and a frontier model, so switching models mid-workflow does not distort the comparison.
Output tokens carry the heaviest weight in the formula because they cost four to six times more than input tokens across every major provider. A 2026 analysis of token pricing found the median output-to-input price ratio is approximately 4×, with some premium reasoning models reaching 8×. Cache-read tokens receive a 0.1 coefficient because cached input is roughly 90% cheaper than fresh input.
The framework produces real results. GitHub reported ET reductions between 19% and 62% across production workflows after applying it. Their Auto-Triage Issues workflow achieved a 62% ET reduction across 109 runs, a saving that compounds with every execution. Run frequency matters as much as per-run efficiency: a workflow that executes 500 times per day at a modest 10% ET reduction saves more than one that runs twice weekly at 50% reduction.
A 10% ET reduction translates directly to a 10% cost reduction regardless of which model is running. Instead of negotiating seat counts or switching providers, teams can optimize the workflows themselves.
Track cost per resolved task per workflow and per agent, not just in aggregate. Per-workflow visibility reveals which automations earn their token spend and which quietly drain budget. Glean's usage analytics dashboard helps teams track AI spend at the workflow level, surfacing per-agent cost breakdowns rather than blunt, org-wide consumption totals. That granularity gives leaders the data to decide which agent-driven processes deliver measurable ROI and which need tuning.
Cache hit rate: the efficiency multiplier most teams ignore
Cache hit rate measures the percentage of input tokens served from cached model state rather than processed fresh. Two caching layers matter. Prompt caching reuses a stable prefix across requests at a fraction of normal token cost, while response caching skips the model call entirely when a request matches a previous query. Understanding how KV caches impact time to first token is essential for tuning both layers effectively.
The cost difference is stark: a 2026 research study evaluating prompt caching across OpenAI, Anthropic, and Google over 500+ agent sessions found that caching reduces API costs by 41–80% and improves time to first token by 13–31%. Semantic caching, which matches similar but not identical queries, cuts API costs by up to 73% in high-repetition use cases.
What breaks caching is often invisible. Long pauses between requests expire cached state, and unstable prefixes force the model to reprocess the full input whenever system prompts or tool definitions change between calls.
Track cache hit rate segmented by time-between-requests to spot these patterns before they erode savings. The strategies Glean outlines in its token efficiency optimization guide give teams a practical framework for structuring stable prefixes and maximizing cache reuse across agentic workflows.
Tool call accuracy and overhead: measuring what agents reach for
Tool call accuracy is the ratio of correct tool invocations to total tool invocations in an agent workflow. Every tool call consumes tokens in three places: the JSON schema that describes the tool, the argument block the model generates, and the response the tool returns. A wrong call wastes tokens at all three points and injects irrelevant context into the conversation window.
The hidden cost is the tool catalog itself. A system with 40 registered tool definitions adds 10 to 15 KB of schema to every turn, even when the agent only uses two of those tools. A structured approach to evaluating AI agents can help teams track three signals to quantify the waste: tools registered versus tools actually invoked per workflow, tokens consumed by tool schemas as a percentage of total input, and success-to-failure ratio per tool.
On-demand tool loading addresses catalog bloat directly by loading only the tools relevant to the current step. In production experiments, on-demand loading reduced per-turn token usage by 8 to 11% across both OpenAI and Anthropic models, while also reducing user error rates by 4%. Glean explains how to identify and reduce hidden token overhead from unused tool definitions, including strategies for auditing which tools contribute to outcomes and which simply consume context space.
Trajectory and step efficiency: how many turns to done
Trajectory efficiency measures the total number of LLM calls, tool invocations, and intermediate steps an agent takes to complete a task compared to the minimum viable path. Each additional step compounds cost because the context window grows with every turn. The model re-reads the full conversation history, and each new tool response adds to the payload.
Step count alone does not tell the full story. Five steps that each advance the task meaningfully cost less than three steps where two are retries or redundant data fetches. The challenge intensifies as agentic workloads scale: Gartner notes that agentic models can require 5 to 30 times more tokens per task than a standard chatbot, making step efficiency critical for controlling costs even as unit token prices decline.
Production teams that moved deterministic reads (fetching file contents, querying databases) out of the reasoning loop and into pre-processing saw 43 to 62% reductions in token consumption for those workflows. Track average steps per task alongside tokens per step to distinguish between workflows that are genuinely complex and workflows that are inefficiently structured. Glean Agents address trajectory bloat through the Agentic Engine, which handles multi-step planning and orchestration grounded in enterprise context from the Enterprise Graph, reducing the steps needed to reach a correct outcome.
Output-to-input ratio: detecting verbose responses and bloated context
Output-to-input ratio divides output tokens by input tokens for a given request or workflow. Healthy ratios vary by task type: a classification task should produce a low ratio, summarization lands in a moderate range, and content generation naturally runs higher.
Two failure modes push the ratio in the wrong direction. Bloated input happens when retrieval pipelines send full documents to the model when a targeted summary would suffice. Verbose output happens when the model generates formatted explanations or multi-paragraph responses when the downstream system reads a single field.
Set explicit max-token limits on every AI step in your pipeline and audit system prompts monthly for scope creep. A system prompt that grew from 500 tokens to 2,000 over six months of incremental additions silently multiplies cost on every request.
Track the output-to-input ratio over time for each workflow. A rising ratio without a corresponding change in task complexity signals prompt drift or retrieval degradation. Glean's retrieval-augmented generation pipeline tackles the input side: the Enterprise Graph fetches only permission-aware, relevant context rather than dumping entire documents into the model's context window.
Latency per token: connecting speed to efficiency
Latency per token divides total time-to-complete by the number of tokens generated in a response. Raw latency tells you how long a user waited. Latency per token tells you how efficiently the system produced each unit of output, making it possible to compare requests that took the same wall-clock time but generated very different token volumes.
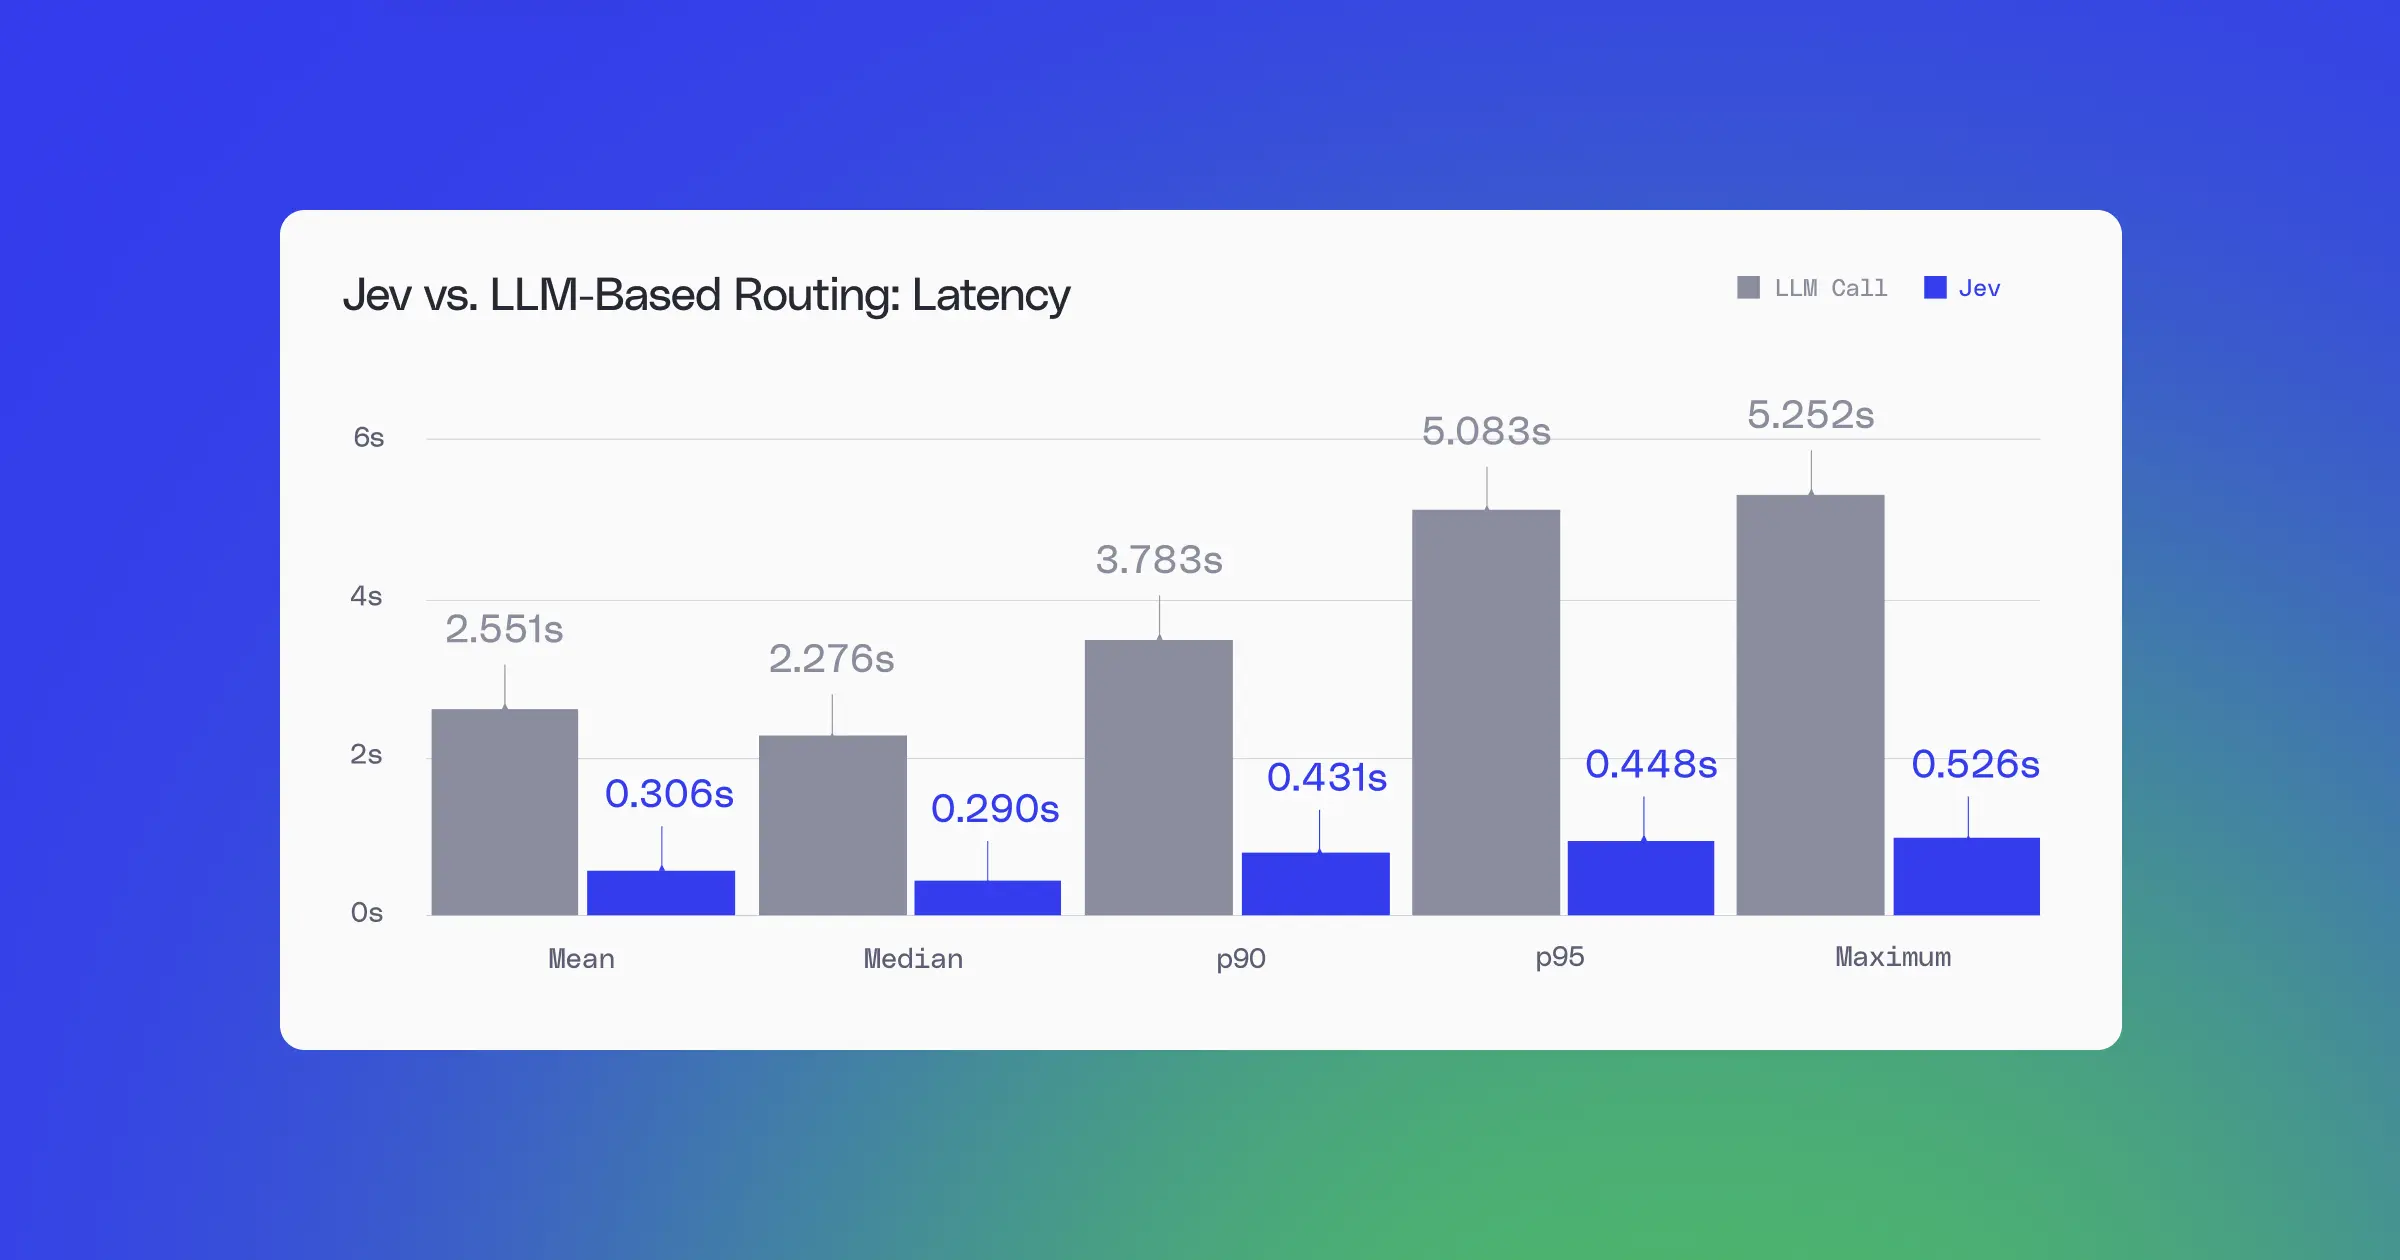
Several factors influence the metric: model size, transport protocol, cache state, and context window length. Research into how input token count impacts latency shows that context size is one of the most significant variables. IDC 2026 found that prompt caching alone reduced LLM latency by up to 34% in high-volume scenarios. Transport protocol often goes unexamined, but it has measurable impact too: in production, WebSocket connections reduced time-to-first-token by 12 to 19% compared to standard HTTP requests by eliminating per-request connection overhead.
Track latency per token segmented by agent type, since a copilot embedded in an IDE has different acceptable thresholds than a background agent processing tickets overnight. A sudden increase without a model change points to context bloat, cache misses, or newly registered tool overhead. Glean Assistant delivers sub-second cited answers by grounding responses in the Enterprise Graph and Personal Graph, keeping the context window tight so the model spends time generating useful output rather than processing irrelevant input.
How to build a token efficiency dashboard that drives decisions
Start with five core metrics: cost per resolved task (normalized using an effective-token formula), cache hit rate, tool call accuracy, average steps per task, and output-to-input ratio. Together, these cover the full lifecycle of an AI interaction from caching through execution to output cost.
Granularity determines whether the dashboard produces actionable signals or noise. Break every metric down per workflow, per agent, and per model. Set alert thresholds that trigger investigation: cache hit rate dropping below 85%, cost per task exceeding twice the trailing 30-day average, tool call failure rate above 10%, or output-to-input ratio drifting more than 20% from baseline.
Run automated daily audits against these thresholds. The same audit pattern that produced 19 to 62% token reductions in production workflows works because it catches drift before it compounds.
The goal is not to minimize tokens but to confirm every token contributes to a correct outcome. Glean's analytics surface per-workflow and per-agent metrics, giving IT and data teams the visibility to compare AI spend against task completion rates rather than managing costs blind.
Token efficiency is not about spending less on AI. It is about knowing exactly where your tokens go and whether they produce outcomes worth the cost. When you track the right metrics at the right granularity, every optimization decision becomes data-driven rather than reactive. Request a demo to explore how Glean and AI can transform your workplace.



.webp)




.webp)

.webp)